Hi
@jansla , I have been giving some thought to the issue with your vehicle and your empty pockets. Considering that
MES can log a maximum of 26 parameters, I have put together a list of what I consider to be the most critical 26 for you to examine. This morning, I took my 2017, 150HP, 2.3L, Comfortmatic Ducato for a drive whilst collecting the data for those 26 parameters so you could have a known reference for what a good engine with no issues or faults, and a very clean exhaust pipe looks like. I have owned the vehicle from new, service it myself, and has no parts replaced at all. It has travelled 36,000km.
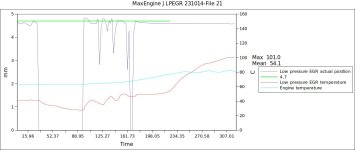
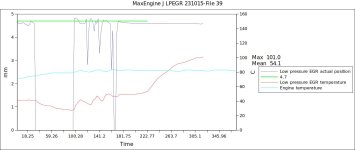
I suggest you load the same parameters and start with a cold motor and go for as long a drive as possible to obtain some meaningful data. I deliberately kept the speed, and throttle demands low for a very significant part of the journey to try and match what I have seen in your past records. You will note that even very early on, without any significant higher speeds that the LPEGR cooler rises to much higher temperatures than what was achieved with your vehicle in its current state.
To analyse the data, I only use
MES graphs – I see no need whatsoever to export the data and view/manipulate in spreadsheets such as excel etc. (As a side note, within
MES graphs you can select any parameter to place on the X-axis to directly plot the relationship for a related parameter on the Y-axis).
My approach is to start with comparing “desired” and “actual” for each parameter individually and selecting the x-axis scale to view the entire drive in one shot – if there appears to be any non-tracking, then zoom in to see the detail – and then if it is a significant non-tracking start overlaying other parameters one at a time to try and find a causal relationship. The reasonable tracking of “actual” to “desired” proves that at least the device is accurately following the ECU instructions – so that we can at least assume the device is behaving correctly.
Then I move through selective parameters overlaying what I consider having likely relationships to each other and look for anything that may be out of place.
To try and keep the number of graphs low in this post, I have not included all the graphs I look at, just some that may be important for you.
For your reference, I provide the
MES file below so you can look at the data in detail. It may well be a good reference for anyone else with similar issues.
I will also post some of the pertinent graphs that I select to examine.
I would be happy to have a detailed look at your
MES file of these 26 parameters once you upload it. I hope the motor will allow you to do so.


") Once again great thank you!
Once again great thank you!