Technical RR results of standard vs BMC panel vs BMC CDA

Currently reading:
Technical RR results of standard vs BMC panel vs BMC CDA

robjnr

Member
Joined
Jun 4, 2010
Messages
363
Points
61
Well i went down to my local dyno yesterday to test the standard paper filter against the BMC panel and the BMC CDA here are the results

scan0001.jpg


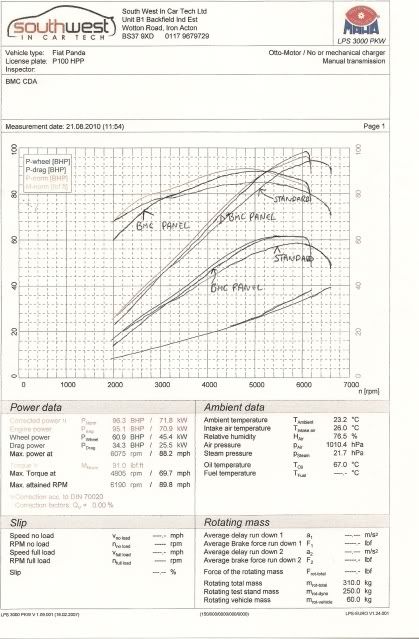
i have traced the results on top of each other so you can see the exact differences between the filters.


Evan got a graph for those who think that sport button off is more powerful ;)
 
As you can see both filters gain power over standard.

Standard result was
94.1 BHP
56.6 BHP @ the wheels
84.8 LBF.FT

BMC Panel
98.1 BHP
60.3 BHP @ the wheels
89.6 LBF.FT

BMC CDA
96.3 BHP
60.9 BHP @ the wheels
91 LBF.FT

As the figures show the panel gave the best power at the fly but the BMC CDA gave the best power at the wheels, but i guess its at the wheels that counts really.

The BMC CDA has an advantage over the BMC panel in the mid range both in torque and bhp which will matter the most in real world driving.
 
Those are very interesting figures thanks for the info. I am no expert but I can still take my own findings from it. The CDA does appear to allow better power at wheels. However you have to factor in the fact that it can get clogged quickly. The results of the BMC panel filter are impressive but it leaves me with a dilemma. The BMC panel filter is a cleanable filter but how good will it be after its cleaned by me. What if I dont clean it properly and it remains partly clogged. I much prefer the idea of just throwing away a filter and putting in a brand new one every year. The cost of the BMC panel filter though (£42.95) is too expensive to do that. I guess you can change it every 2 years but would it be too clogged by that time and would the cost still be too much?

So for me its either having the ease of use of just throwing away a filter every year and putting in a new one. Or having a tiny bit more power and torque. But also having to clean the filter and risk not doing it properly and so maybe adversely affecting the performance. In the end for me I will just stick with the regular paper filter and put in a new one every year. I dont do track days and the tiny bit of extra power and torque wont be noticeable for how I use the car.
 
fly figures are all calculated from wheel figures, so how that happen then?:confused:

I don't know, car was strapped down the same on all runs, i don't know why there was more drag on the panel filter run.

I have another graph with the BMC CDA but with sport button off, and the power was
96.2 BHP
90.6 LBF.FT
61.7 BHP @ the wheels

Which is down on the fly wheel power compared with sport button on but up on the wheel power.
 
Definitely something iffy with the dyno readings....

If the drivetrain is 90% efficient that means that if you have 100bhp 90bhp are going to get to the wheels, if you have 110% then that means 99bhp will be getting to the wheels.

Very strange indeed.
 
Don't take this the wrong way, but something doesn't add up.

Why does the drag change so much between the runs? Your figures show the drivetrain losses decreasing on the higher power runs, but the graph seems to show it increasing for the BMC filters (and inflating the power figures by a few bhp)?

And why do the runs end abruptly and early compared to the standard filter?

(Someone correct me if I'm wrong, it's late and I'm tired :cry:)-

As you can see both filters gain power over standard.

Standard result was
94.1 BHP
56.6 BHP @ the wheels 40% losses
84.8 LBF.FT

BMC Panel
98.1 BHP
60.3 BHP @ the wheels 39% losses
89.6 LBF.FT

BMC CDA
96.3 BHP
60.9 BHP @ the wheels 37% losses
91 LBF.FT

fly figures are all calculated from wheel figures, so how that happen then?:confused:

Look at the drag figures at the bottom of the graph. Higher losses = higher flywheel "correction" figures.

Nearly 40bhp losses for a FWD car seems high anyway IMO? :confused:
 
Look at the drag figures at the bottom of the graph. Higher losses = higher flywheel "correction" figures.

Nearly 40bhp losses for a FWD car seems high anyway IMO? :confused:

I wonder if the gear the runs were done in may have had some effect. Maybe they used different gears in different runs? Also some components in the drivetrain may have heated up somewhat, which may also cause some variation.

It's hard to know really, but I agree the losses do seem high, which may well be indicative of the how well the dyno measures the drag figures, in that if it is exagerated, then they may show bigger differences than what they actually are.
 
Don't take this the wrong way, but something doesn't add up.

Why does the drag change so much between the runs? Your figures show the drivetrain losses decreasing on the higher power runs, but the graph seems to show it increasing for the BMC filters (and inflating the power figures by a few bhp)?

And why do the runs end abruptly and early compared to the standard filter?

(Someone correct me if I'm wrong, it's late and I'm tired :cry:)-


Look at the drag figures at the bottom of the graph. Higher losses = higher flywheel "correction" figures.

Nearly 40bhp losses for a FWD car seems high anyway IMO? :confused:

Don't shoot me I'm just the messenger lol, the dyno guy did everything the same on every run, we let the car cool for 20 mins in-between changing the filters.
 
Was the guy totally independant- ie, doesn't sell the BMC kits or provide them for your tests?

Yes he is, I provided the filters all he done was stuck it on the RR for me. He was just as interested as I was to find out the results
 
Top marks for going to the effort of doing this. (y)

I'm not sure your results show any validity. However, if they do, then it's pretty clear it's not worth changing the filter.

eh? I read this as showing 4-5% improvement in HP and torque which isn't too bad for the money (but get an insurance quote for any mods first!). Since they were done on the same car, the same road, the same day they are pretty valid IMO.
 
eh? I read this as showing 4-5% improvement in HP and torque which isn't too bad for the money (but get an insurance quote for any mods first!). Since they were done on the same car, the same road, the same day they are pretty valid IMO.

Yes, it's not too bad at all. Air filters are never going to give a huge increase. I guess the discrepancies were more with the odd figures that came out of the dyno.
 
if its a hollow drum rr and/or has a temperature probe that relies on the operator putting it in the right place and/or does not calculate for power fluctuation coming from the grid, that can cause all sorts of strange things to happen to results

Also if the operator increases the drag on the coast-down (eg, applying light brake pressure) it would increase the compensation factor @the fly... not that I'm suggesting this happened! The graph shows the drag increasing by about 3-4 bhp at the top over the standard filter, which could inflate the calculated fly figure.

At the end of the day, only judge it by the @ the wheels numbers, as any flywheel figures are estimates (this goes for every chassis dyno). ;)

Ambient temp and intake temp differ by only 3 deg Dave, so won't have a noticeable factor in the results. Judging by the data at the bottom (and the wheel drag being shown on the graph) I'd say it was an inertia drum-type IIRC- your preferred dyno type, Dave. ;)

Interestingly, the graph shows a noticeable loss in power below 3,000rpm when using the BMC filter. :eek:

Edit- just googled it- Maha 3000 is an Eddy Current type. Odd that it lists the drag figures and 'run down' in the box at the bottom...
 
Last edited:
Figures are

Standard wheel power
56.6 BHP

BMC panel wheel power
60.3 BHP +3.7 BHP

BMC CDA wheel power
61.7 BHP +5.1 BHP 9% increase in power at the wheels with just a filter isn't bad at all. If the panda could be mapped then you will see more gains with the filter
 
Back
Top