

You are using an out of date browser. It may not display this or other websites correctly.
You should upgrade or use an alternative browser.
You should upgrade or use an alternative browser.
Technical Fiat Panda 169/2005 High Fuel Consumption on idle/stationary
- Thread starter marinosg
- Start date
Currently reading:
Technical Fiat Panda 169/2005 High Fuel Consumption on idle/stationary
Can’t work out what’s going on at the moment
O2 post CAT is pegged lean but the plugs aren’t showing lean
Sensor not reading correctly
Scanner not reporting correctly
Blocked CAT
exhaust leak
And many more
Thinking about the next move
Engine hot, stead revs over 2K is the post O2 still pegged low
O2 post CAT is pegged lean but the plugs aren’t showing lean
Sensor not reading correctly
Scanner not reporting correctly
Blocked CAT
exhaust leak
And many more
Thinking about the next move
Engine hot, stead revs over 2K is the post O2 still pegged low
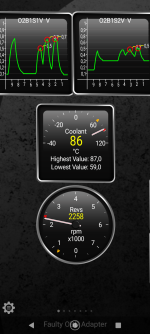
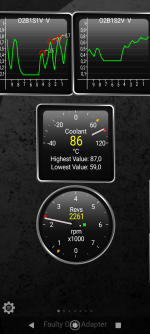
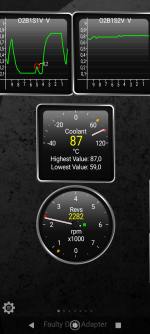
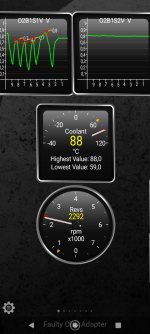
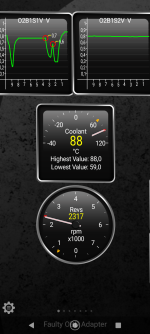
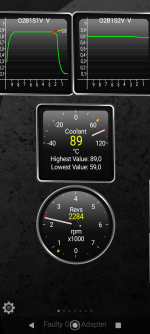
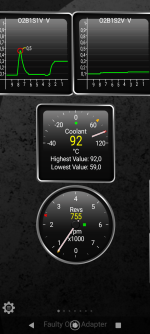
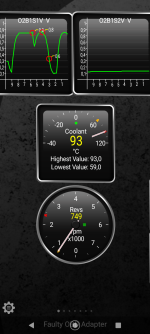
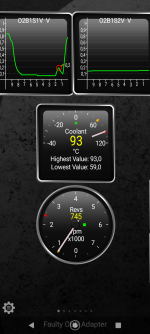
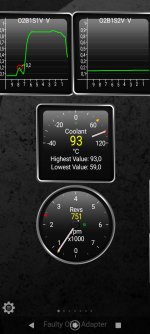
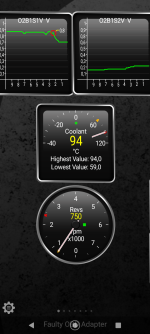
snapshots 1-6: 2000RPM warm engine, O2 readings.
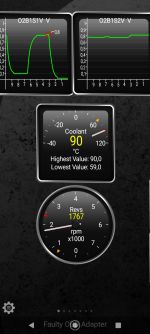
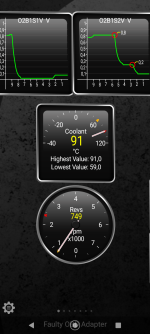
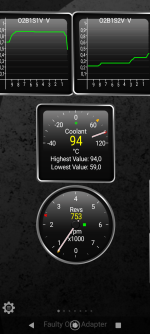
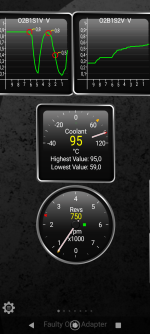
snapshots 7-15: then released the gas pedal and dropped RPM to 750-800
snapshots 7-15: then released the gas pedal and dropped RPM to 750-800
Attachments
-
 1.png380.6 KB · Views: 70
 -
 2.png379 KB · Views: 103
 -
 3.png369.7 KB · Views: 56
 -
 4.png376.5 KB · Views: 65
 -
 5.png369.7 KB · Views: 71
 -
 6.png365.3 KB · Views: 48
 -
 7.png365.5 KB · Views: 56
 -
 8.png365.9 KB · Views: 64
 -
 9.png364.4 KB · Views: 57
 -
 10.png372.4 KB · Views: 55
 -
 11.png364.2 KB · Views: 55
 -
 12.png365.6 KB · Views: 49
 -
 13.png363.6 KB · Views: 52
 -
 14.png361.6 KB · Views: 60
 -
 15.png375.1 KB · Views: 61
Thanks for the new screen shots
Acceleration adds fuel, sensor goes high, steady revs sensor flat lines, release the accelerator and the fuel is reduce and the sensor goes low
Both sensors look perfect as does the CAT @ 2K
Which makes sense as it’s not throwing an engine error code for sensor or CAT
Just as far as I remember at idle the O2 sensor reads fairly flat. But as per previous screenshots your O2 post CAT sensor is occasionally sitting at 0V and jumping around
Might try and get a reading from my car tomorrow
- Joined
- Feb 28, 2016
- Messages
- 852
- Points
- 234
E5
E10
E85.
I've not come across the E85 fuel before. Is this a further step
Tim
E10
E85.
I've not come across the E85 fuel before. Is this a further step
Tim
- Joined
- Sep 14, 2009
- Messages
- 19,852
- Points
- 3,392
UK has 95 Ron gasoline that's 10% ethanol (E10) and 97 or 99 RON that's often E zero. E 85 (85% ethanol) and less than 95 RON are not available** at retail pumps.
** I have never seen it
** I have never seen it
this post got me into lots of thinking...Had to do a 12 mile journey today, with no time pressures, so reset my display to km, and to show the instantaneous fuel consumption. Of course, recording them as I drove was not possible, but had to stop at some long-delay traffic signals and wrote stuff down. Here's what I think I remembered.
First, some detail.
2006 Panda 1.2 60hp 137326km
Outside temp 17°C Climate control set to 17.5°C Aircon running
Thermostat seems a little lazy, as it took longer than usual to get to normal temp, on a warm day. (Looks like time to replace the stat.)
From cold start, first few metres showed 25l/100km, reducing quickly to around 15-17l/100km for the first few hundred metres.
Moving at 20km/hr 12-15l/100km, engine still warming up.
Once up to temp:
Off accelerator, back to 25l/100km, which appears to be the maximum it will read.
Slow-moving traffic, 20km/hr 7-8l/100km, 30km/hr 6l/100km
Slightly faster traffic, 70km/hr 4-5l/100km
Average over journey, 5.3l/100km
The average once returned to my normal mpg figure is what I've been experiencing over the last 12 years, so whilst some figures may look thirsty, they seem to be OK, and therefore normal.
I've no idea whether I can record these using MultiECUscan, and create a report or graph, but I may have a look at that at the weekend.
Meanwhile, my advice would be to work on the average only, not instant figures. The instant readout, on any car, is distracting, and potentially dangerous, as it demands attention, when we should all be looking out the windows instead.
the measurements you get are very similar to mine... so could it be then that I have totally mixed things up?
in a previous post I mentioned that my Panda was not measuring in this way in the previous years... and I was pretty sure about this.
But based on your post... it seems that I may have mixed up with my other car (Renault Grand Scenic). Sorry for causing also here confusion about this.
So, these computer fuel consumption measurements cannot / should not be used as an indication that something may be wrong with the car.
the only real indication is that I get 150-200 km distance of city driving with a full tank, and the smell of gas I get sometimes when on idle.
I have now tried few things (cleaned purge valve, cleaned injectors, cleaned O2 sensors) so let me drive around for some time and get some new (real) measurements. I will be on holiday for the next few weeks so I will come back with some new data.
thanks to all for good inputs.
Last edited:
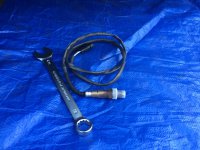
could you pls share a photo of this, so I know what I am looking for?fuel smell is normally associated with a split emissions pipe near the fire wall, could this be the problem after all.....
No because I dont own a 1.2 but you can do a forum search for the issue, here is one thread that might be of interest https://www.fiatforum.com/threads/breather-hose.492032/#post-4626088could you pls share a photo of this, so I know what I am looking for?
Heard this before, I may have even repeated this myself in the pastfuel smell is normally associated with a split emissions pipe near the fire wall, could this be the problem after all.....
But thinking about it I don’t understand the fuel smell from the vapours the valve cover.
Obviously it’s not good for the environment having it disconnect but it doesn’t effect the running as far as I can tell. Even with the whole air box removed the O2 sensor readings look normal and no fuel smell. There’s is a smell of fuel when there is a misfire and the throttle body opens to stop it stalling
You get a slight oil burning smell in the cabin with it completely disconnected from but left under the air box
- Joined
- Sep 14, 2009
- Messages
- 19,852
- Points
- 3,392
This is off the box - Has the timing belt been replaced recently? If it's mistimed that might create a blow-by using fuel smell and reduced power.
Full service including timing belt (and more) was 4 years ago.This is off the box - Has the timing belt been replaced recently? If it's mistimed that might create a blow-by using fuel smell and reduced power.
Let’s start at the beginning
smell of petrol
Unburnt fuel in the exhaust very common. Economy will suffer
Fuel leak rare but possible
Faulty evap system it’s unlikely you would also see a noticeable decrease in economy. And they nearly always fail after being over filled
We need to find the source of the smell, the rest should fall into place
I’d be checking the exhaust first. Prolonged Fuel entering here can cause the catalytic converter go bad.
Lullaby
New member
- Joined
- Aug 26, 2021
- Messages
- 18
- Points
- 5
OBD2 Lambda above 1.0 volt, replace (cat. wil burn (expensive replacement) and real bad fuel mixture whit smell).
Pre and post cost around 70 pound (Bosh).
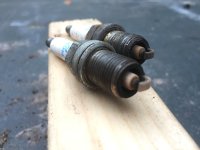
Spark pluck white overheated and lean bank, more oil.
Overheated cilinders use more oil (Is your oil consumption higher than usual), if more oil is used than more oil consumption results in black carbon lambda resulting in wrong mixture.
Pre and post cost around 70 pound (Bosh).
Spark pluck white overheated and lean bank, more oil.
Overheated cilinders use more oil (Is your oil consumption higher than usual), if more oil is used than more oil consumption results in black carbon lambda resulting in wrong mixture.
Attachments
I had not really noticed/tracked the oil consumption in detail previously. Oil meter indication has always been close to "MAX" but this is a good hint. I changed the oil yesterday so let me track the oil level in the next few weeks and I will get back on this.
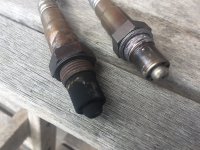
@Lullaby, are you suggesting that my O2 sensors could/should be replaced? both of them? Bosch or NGK ?
@Lullaby, are you suggesting that my O2 sensors could/should be replaced? both of them? Bosch or NGK ?
Original O2 are Bosch and are normally good for the life of the engine, as long as the engine is running correctly
It’s mostly the Pre CAT O2 deals with fuelling
Post CAT is mostly for monitoring operation of the CAT
It would be highly unlikely for both to fail. You can swap them over and retest before buying anything
If the results are the same (not 100% but pretty close) I wouldn’t be spending out on a gut feeling
I would be doing the simple and/or free things to try and narrow the problem down first
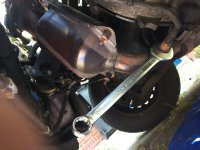
Is the smell of petrol coming from the exhaust
What are the compression test results. Both a slipped belt and head gasket can cause poor economy and smell of petrol
What are the long term fuel trims at idle and at a steady 2K
Swapping parts can get very expensive if you fail to hit the problem straight away
It’s mostly the Pre CAT O2 deals with fuelling
Post CAT is mostly for monitoring operation of the CAT
It would be highly unlikely for both to fail. You can swap them over and retest before buying anything
If the results are the same (not 100% but pretty close) I wouldn’t be spending out on a gut feeling
I would be doing the simple and/or free things to try and narrow the problem down first
Is the smell of petrol coming from the exhaust
What are the compression test results. Both a slipped belt and head gasket can cause poor economy and smell of petrol
What are the long term fuel trims at idle and at a steady 2K
Swapping parts can get very expensive if you fail to hit the problem straight away