Technical GP 2009 Petrol / LPG 1.2 8V - Understanding Lambda Readings

Currently reading:
Technical GP 2009 Petrol / LPG 1.2 8V - Understanding Lambda Readings

francocm

New member
Joined
Jul 29, 2013
Messages
10
Points
3
Hi guys,

I have some issues relating to performance, and the LPG service garage noticed a constant juggling between lean and rich mixture and advised me to have it checked out.

The car is a 2009 Grande Punto 1.2 8V Petrol converted to LPG.

So now I did the following:

1) Connected MultiEcuScan.
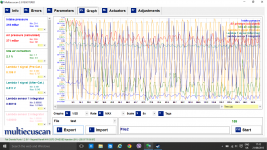
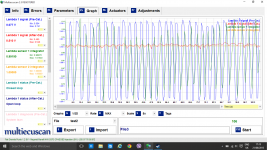
2) Plotted a graph of:
--- Lambda 1 signal (Pre-Cat.)
--- Lambda 1 signal (After-Cat.)
--- Lambda sensor 1 integrator
--- Lambda sensor 2 integrator
--- Lambda 1 diagnosis (Pre-Cat.) (this is not plottable)
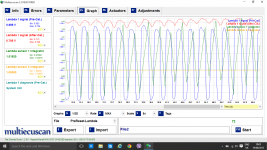
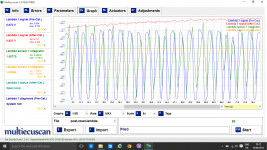
3) Did a 'self-adaptation parameters' reset and a 'phone wheel learn' reset.
4) Plotted the same graph as point 2 above.

I noticed that the 'Lambda 1 diagnosis (Pre-Cat.)' reading constantly switches between lean and rich every ~1.5 seconds which is not good from what I can understand.

Some background information: The car was converted to LPG after-market. Recently I noticed that the LPG injectors going into the intake manifold are connected a bit wonky and they're held in place only with some metal glue. Could it be that excess air is going inside the intake manifold due to this, and the car ECU is caught in an infinite loop trying to correct this?

You can find the screenshots attached.

If anyone can help in understanding these lambda graphs please, I would be grateful.

Thanks

Edit: Forgot to mention, the readings are taken on Petrol not LPG.
 

Attachments

  • pre-reset-lambda.png
    pre-reset-lambda.png
    165.2 KB · Views: 229
  • post-reset-lambda.png
    post-reset-lambda.png
    178.9 KB · Views: 189
Last edited:
Not looked at lambda graphs before, so no idea if that is normal or not.

The lambda sensor will rapidly switch between rich and lean, as the ECU adjusts the fuelling, so this could well be a normal reading. If there was an air leak, I would expect it to run weak, with a constant correction towards richer, giving a flatter graph, either higher or lower. Just theorising at this stage.

To test if the injectors are allowing air in, test this by spraying WD40, or similar at them with the engine running. If there is a leak, it will suck in the spray and the engine note will change.

It might help if you described the problem you are experiencing, as your original post does not tell us this.
 
Thanks for the reply. What you say makes sense too.

Regarding my problem:

Basically lately I've lost a noticeable amount of power. To put you in the picture, there is this particular hill which the car used to be able to handle at 110-115km/hr quite easily. Now it's only managing at 85-95km/hr, rarely touching 100km/hr. Always with the same load in the car (I.e. just me).

I can notice the loss of power at any point in driving wherever I need power, ex. Moving from 0 at an uphill road; or I need to accelerate quickly.

Issue is there regardless of whether I'm on Petrol or LPG.

Driving with 5 people on board (including driver) becomes a bit difficult....

Worth mentioning but not sure whether it's relevant, a few months ago I had an exhaust leak due to some studs on the exhaust manifold being broken and the air leaking from there. This was fixed around 2 months ago. I noticed a bit of an improvement after this, but nothing spectacular.
 
That's how lambda sensor works.

Switching voltage on pre-cat sensor indicates a good sensor. (Well not always but anyway). A lambda sensor will generate up to about 0.9v when the fuel mixture is rich and about 0.1v when the mixture is lean. And because that's how the engine works you see this switching voltage result on your graph.

Post cat sensor should maintain a constant voltage on idle. If the voltage follows pre cat then you have a bad cat.

(Notice that all these applies only at idle-closed loop)

Now about your graphs.

Like I said the switching voltage is a good thing but you expect a voltage between 0.1 and 0.9v.

Since you have a max voltage of 0.73v you have a lean mixture.

This could be from a leaking injector like you suspected.

Can you post adaptation bank 1 MUL and ADD?
 
Thanks for the reply.

Can you explain what "post adaptation bank 1 MUL and ADD" are? Extra parameters in MultiEcuScan?

I'll give it a look later today. Noticed also that consumption isn't that impressive either. Since the reset 3 days ago, I'm averaging 11.1km/l where it used to be around 12.5 - 13. Always on Petrol. Even before the reset I had the same consumption.

Thanks
 
So... I couldn't find anything about 'post adaptation bank 1 MUL and ADD' in MultiEcuScan... is that how they are called?

In the meantime, I re-did the test since I've been driving approx 3 days since the reset. You can see it attached.

I also went for a ride, and recorded a bunch of parameters which you can see in the CSV: https://www.dropbox.com/s/rjmihm3bsli0s4i/drivetest2.csv?dl=0

What surprises me:
- The amount of times engine torque is 0Nm when the desired is quite a different value. Why 0?
- The amount of times that idle air correction goes up to 6553.5%. This is funny because the maximum value of an unsigned short (16-bit number) is 65535. To me this means that the sensor / reading is at its maximum possible.
- Lambda 1 Status (after cat.) is almost all the time in 'open-loop'.
- Lambda 1 Diagnosis (after cat.) is initially 'Not Active', but eventually starts doing the rich / lean cycle too just like the pre-cat. Is this fine?

Now, I am a software developer, not a car expert, so I have absolutely no idea what the above means in terms of cars, but I'm trying to apply some logic to the problem to the best I can with what I know. Please correct me where I don't know or get wrong.

Also, strangely enough, the car feels happier if I drive with the a/c on... it's like the a/c is cushioning / compensating for something due to its load... Shouldn't it be the opposite? This doesn't happen always.

Thanks for the feedback.
 

Attachments

  • test1.png
    test1.png
    344.4 KB · Views: 71
  • test2.png
    test2.png
    213.1 KB · Views: 60
Back
Top