Off Topic jetta 2.0fsi

Currently reading:
Off Topic jetta 2.0fsi

http://www.rri.se/spec/view/png/graph/STR-03052701-kW-Nm-C.png

and heres a 2.0FSI power curve in comparison

See the torque is much more constant, though the t-jet has higher peak torque and larger area under the graph, the 2.0fsi has higher torque later in the rev range. Again showing that the 2.0 NA engine has a broader torque delivery across the full rev range, although peak-peak it is inferior to the t-jet.
 
Last edited:
I wish I wasn't just on my phone, I'd like to post a standard t-jet torque curve that looks nothing like the one you have posted. It has a horizontal section from 2000 to 4000rpm. Is the one you have posted on the original vl37? If so this may explain why it drops away so early as the tiny turbo can't shift enough air to satisfy the re-mapped boost limit. Sure you still have more torque than standard at 4000rpm but the huge peak that occurd earlier has turned a horizontal line into a negative gradient.

I take your point that a non turbo cars torque doesn't fall away at high rpms but I think most people would consider good low and mid range torque to satisfy the phrase 'broad'.

As for turbo diesels, they have the broadest torque curves of the lot! They can hold peak torque from as low as 1750rpm to well into the mid range. Sure after mid range it tumbles away quickly but as said before it is low and mid range torque output that defines 'broad'.
 
Last edited:
I wish I wasn't just on my phone, I'd like to post a standard t-jet torque curve that looks nothing like the one you have posted. It has a horizontal section from 2000 to 4000rpm. Is the one you have posted on the original vl37? If so this may explain why it drops away so early as the tiny turbo can't shift enough air to satisfy the re-mapped boost limit. Sure you still have more torque than standard at 4000rpm but the huge peak that occurd earlier has turned a horizontal line into a negative gradient. .

A standard t-jet has a pretty similar torque curve just the mapped t-jet is translated up and holds onto boost slightly longer. Also where is this horizontal line you keep talking about?!?!?!?! i don't see ANY horizontal line, and never have done.

As for turbo diesels, they have the broadest torque curves of the lot! They can hold peak torque from as low as 1750rpm to well into the mid range. Sure after mid range it tumbles away quickly but as said before it is low and mid range torque output that defines 'broad'.

Stop defining it as "broad."

Turbos do not produce broad torque figures. Broad implies that they are relatively constant and across the board. Turbos do not do this. Turbos kick in, with non-linear torque and then die out as the revs increase (depending on size of turbo and setup).

Turbos torque delivery across the rev range is limited compared to that of an NA car.

As for diesels, turbos have been used a lot more readily with them due to the engine not being as high revving as a petrol - Due to the turbo only providing power over a limited range. This is why many manufacturers used to shy away from using them on petrol cars until more recently.


Anyway I'm getting bored of this and feel like I keep repeating myself. If you're doing mechanical engineering you should learn about this in energy systems/thermodynamics just like I did.
 
Got beaten by a Mini Countryman today, most depressing moment ever.
However I was quite pleased with myself when the driver too busy trying to hold me off clipped a curb and had to stop and I just breezed passed with the biggest grin on my face ever :D.
I hope I ruined his day. :p
 
backpain-1292835351.jpg
 
Here's a different dyno result for a t-jet. As you can see there is a large horizontal section of the torque curve. I can't however explain why this contradicts the graph you posted.

Dyno_Run_Standard.JPG


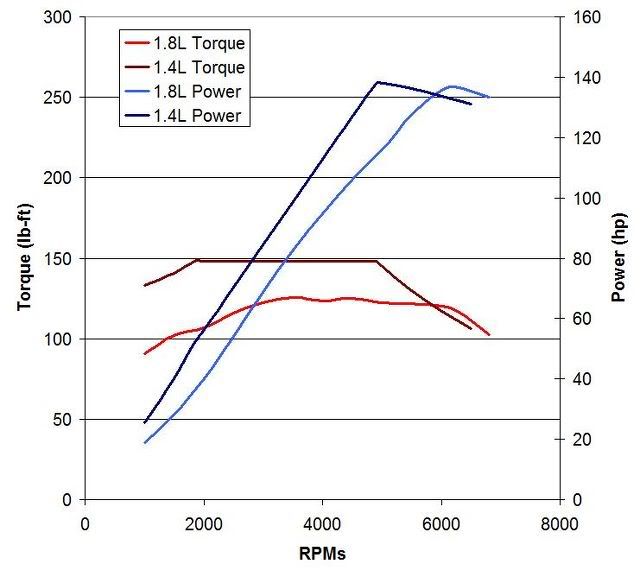
Here is just one of many graphs on google images comparingNA and Force Inducted engines. Again, the 1.4 turbo has a large horizontal sectionin its torque curve in the low to mid range; this I consider to constitute a ‘broad’torque spread. Once again I agree that the torque drops off rather rapidly atthe top end and that before it is on-boost it is also pathetic.


comparison18vs14tecotec.jpg


As for Mechanical Engineering, I have a 1st class MEng, two years of Formula Student, 4 years as a proffesional automotive design engineer and i'm currently 2 years into a Ph.D in vehicle dynamics. Ok engines aren't my specilist area but i'm no fool.
 
that is not a healthy t-jet graph, the oscillation at the start of the curve should not occur.

my t-jet power curve looked totally different to that, very similar to the one i posted, however this was with the vl38 turbo so the peak was reached at slightly higher revs.

and looking at those graphs you posted, top 10% of torque from the turbo is from about 2000rpm to about 4000 rpm.

top 10% of torque from the NA is from about 2000rpm to 6500rpm.

assuming they both rev to 6500rpm, the turbo has a 90+%torque available for 30% of full rev range

NA has 90+% torque available for 69% of the full rev range

So which has the broadest torque delivery again?
 
As for Mechanical Engineering, I have a 1st class MEng, two years of Formula Student, 4 years as a proffesional automotive design engineer and i'm currently 2 years into a Ph.D in vehicle dynamics. Ok engines aren't my specilist area but i'm no fool.


*professional
*specialist

that's a shame about your spelling then...
 
I notice Ian's torque before the re-map didn't peak until about 2900rpm while fiat claim 1750rpm. Odd.
 
it's puntomatt's curve after remap.

yeah i've seen the peak torque figures given over a range before, i guess 1750rpm must be the lower end of the range.
 
Back
Top